NSSA CWC 2027 · Experimental Dashboard
Vilnius 3.0 Crosswalk · v01 · Mar 2026
09.10.2027 → 26.11.2027·An economic field report
Forty-fourmatches.One nation ready.
A venue-weighted account of every Rand, every visitor, and every job from the 44 SA-hosted matches of the ICC Cricket World Cup 2027 — measured under the Vilnius 3.0 NSSA framework.An experimental satellite-account estimate. Not official Stats SA data.
Total GVA · Base case
R2.72bn
Scenario range R2.31bn – R3.13bn (Low / High)
12,150
FTE jobs supported
581K
Person-entries
R303m
Indicative tax
8
Venues · 6 cities
NSSA Workstream · Experimental estimateCrosswalk Model v01 · March 202644 / 54 matches · 8 venues · 49 days
!
Read this first. These are model outputs from the NSSA Vilnius 3.0 Crosswalk (v01), not official Stats SA data. Headline GVA of R2.72bn sits within a Low–High range of R2.31bn – R3.13bn. The R303m indicative tax revenue does not net out public outlays for security, transport and venue readiness (typically R500m–R1bn), so net fiscal position may be neutral or slightly negative — normal for mega-events. See the Methodology and About pages for full disclosure.
Days to Opening Match
—
Live countdown · 9 Oct 2027
Volunteers Required
8,400
Across 8 venues
Local Procurement Target
75%
R2.25bn retained of R3bn ops
Broadcast Reach (est.)
1.6bn
Cumulative global viewers
Diesel Backup Reserve
R45m
Load-shedding contingency
Reserve Match Days
6
Built into the schedule
01
Headline Figures · Base Case
The CWC 2027 SA economic story at a glance
Total GVA (Direct + Indirect)
R2.72bn
incl. supply-chain uplift
Gross Spend Activated
R3.95bn
across all channels
Direct GVA
R2.09bn
at 53% conversion ratio
Total Attendance
0
person-entries across 44 SA matches
Jobs Supported (FTE)
0
12,149 full-time equivalent positions
Indicative Tax Revenue
R303.3m
VAT R120.5m + PAYE R121.5m + CIT R61.3m
Gross Activated Spend Composition
Total: R3.95bn (R millions)
Operations Retained
63.0%Tourism
30.4%Matchday
6.6%Matchday Revenue Breakdown
Total: R258.7m
Ticket Revenue
62.2%In-Stadium Spend
21.3%Hospitality
16.4%GVA Waterfall: Spend → Direct → Total
R millions
Tax Revenue Distribution
Total: R303.3m
PAYE
40.1%VAT
39.7%CIT
20.2%02
Tournament Calendar
Key dates · 49 days of competition
- 9 Oct 2027Opening Ceremony & First MatchWanderers, JohannesburgT1
- 12 Oct 2027South Africa vs India (Group)Newlands, Cape TownT1
- 18 Oct 2027South Africa vs AustraliaKingsmead, DurbanT1
- 30 Oct 2027Group Stage concludesAll venuesT2
- 5 Nov 2027Super Eights beginBig 3 venuesT1
- 16 Nov 2027Semi-Final 1Newlands, Cape TownT1
- 18 Nov 2027Semi-Final 2Wanderers, JohannesburgT1
- 26 Nov 2027FINALWanderers, JohannesburgT1
03
Tourism & Visitor Economy
Outside-venue spend across visitor segments
Domestic Overnight Trips
78,462
Avg 4 nights × R1,800/day = R564.9m
International Trips
19,373
Avg 7 nights × R4,500/day = R610.3m
Day Trips
87,180
R300 per trip = R26.2m
Total Visitor Spend
R1.20bn
R1,201,340,400 outside-venue spend
04
Host Cities
6 cities · 8 venues · the national footprint
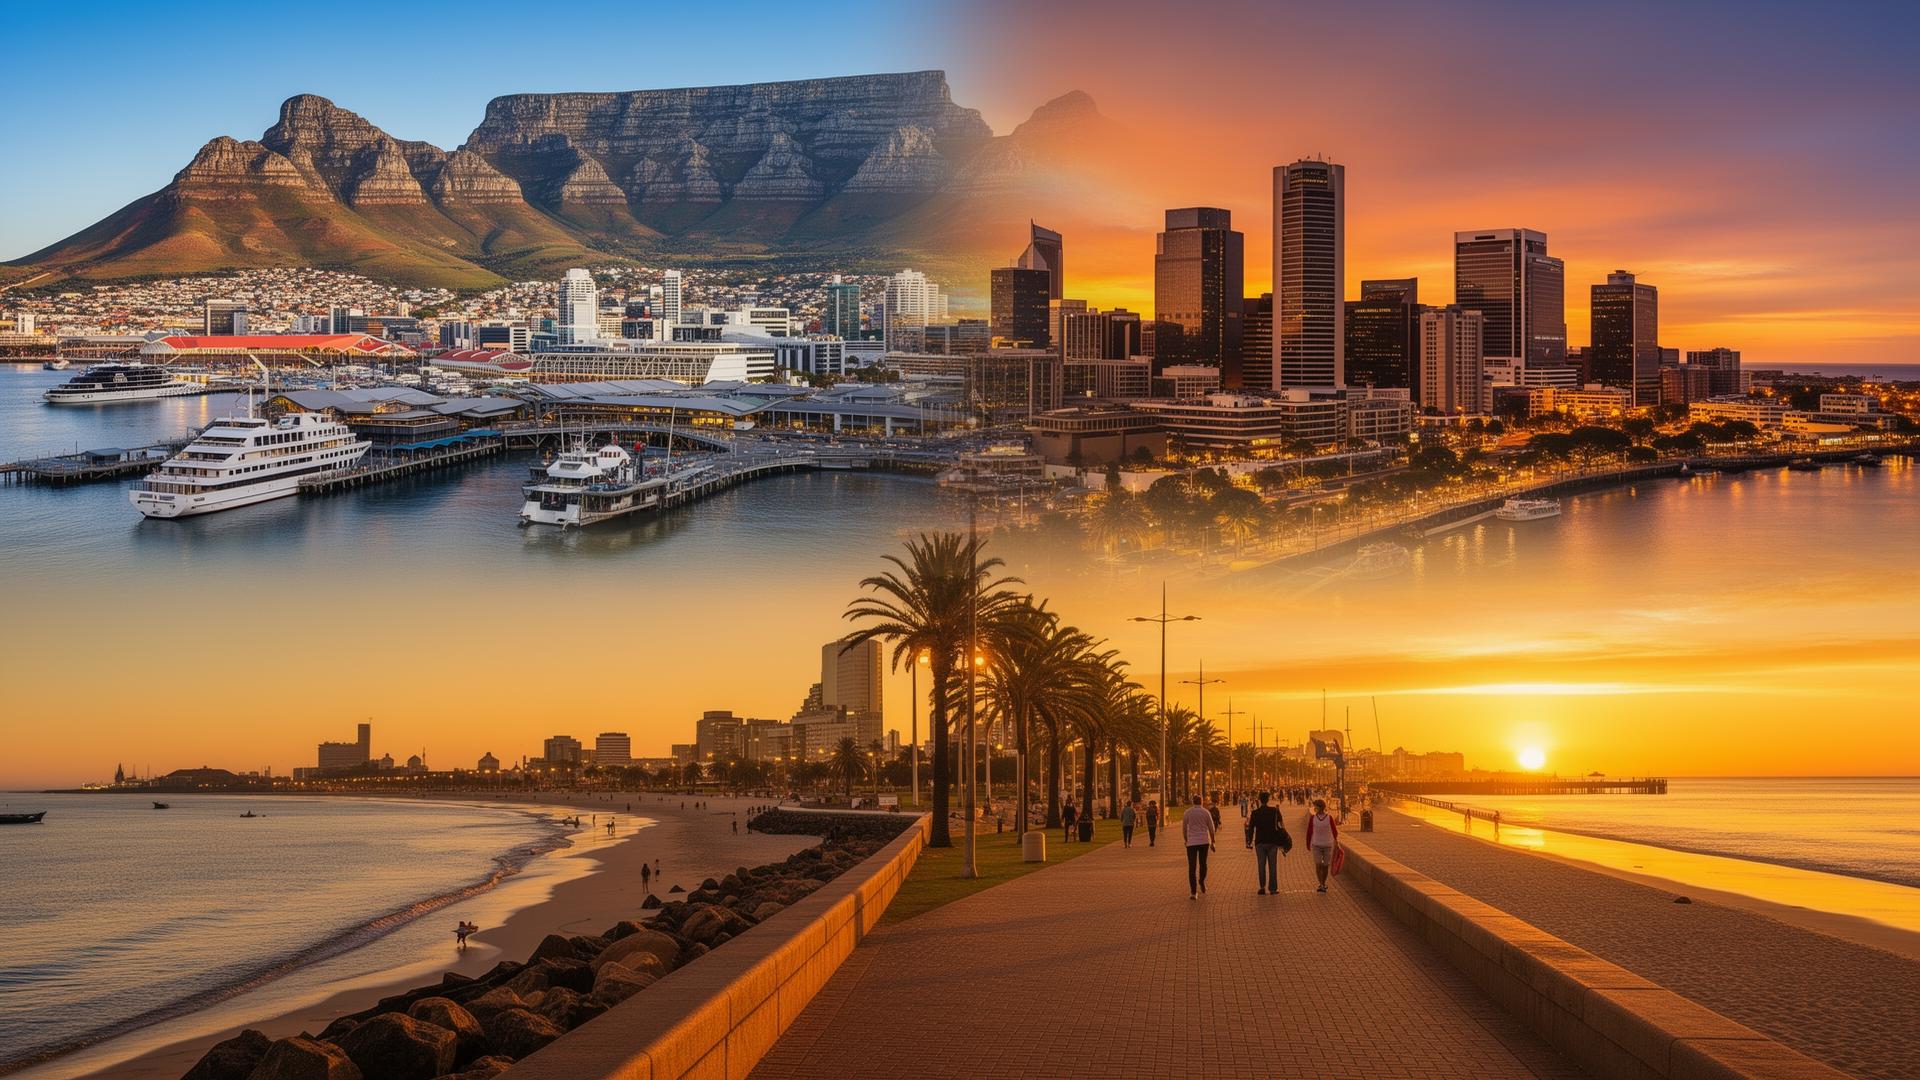
Coast to coast
Cape Town · Joburg · Durban
+ 5 host cities
+ 5 host cities
| City | Province | Beds | Note |
|---|---|---|---|
| Johannesburg | Gauteng | 32,500 | Tournament hub & final |
| Cape Town | Western Cape | 28,000 | Marquee tourism magnet |
| Durban | KwaZulu-Natal | 22,000 | Coastal fan village |
| Centurion | Gauteng | 8,400 | Spillover host |
| Gqeberha | Eastern Cape | 6,200 | Regional venue |
| Bloemfontein | Free State | 5,100 | Heartland venue |
| East London | Eastern Cape | 4,300 | Coastal regional |
| Paarl | Western Cape | 3,200 | Winelands venue |
05
Delivery Partners
The coalition behind the tournament
Cricket South Africa
ICC
Dept. of Sport
SA Tourism
Brand SA
Eskom
Gautrain
SAA
Delivery rests on coordinated input from Cricket South Africa, the ICC, government departments, energy and transport infrastructure providers, and tourism agencies — each with measurable accountabilities tracked in this dashboard.